Food Focus Thailand
NOVEMBER 2013
20
Japan
Items
FY1965
FY2011
US
EU
France Germany England Australia
Korea
Nevertheless, environment and energy crisis which are over-
control factors, have triggered food scarcity and affected human being.
Sustainable agriculture, therefore, will be the solution of choice to foster
food security. In this regard, Food Focus Thailand Magazine was cordially
invited by Asian Productivity Organization (APO) to experience the best
practices in promoting innovation and productivity in agriculture sector
during September 9-14, 2013 at Tokyo, Japan. Let’s enjoy the impressive
productivity journey with us!
Food, Agriculture, and Agricultural Communities in
Japan
According to Statistics Department, Ministry of Agriculture, Forestry
and Fisheries (MAFF), in 2009, the primary industry sector (agriculture,
forestry, and fisheries) production value was 11.3 trillion yen. Combined
with the secondary industry sector (manufacturing related to primary
industry sector products) and the tertiary industry sector (distribution and
food services), the agriculture and food-related industry sectors produced
a total of 95.3 trillion yen. These sectors constitute one of the largest
industries in Japan, accounting for 11 percent of domestic production.
การบริ
การจั
ดเตรี
ยมอาหาร) ด
วยแล
ว พบว
าอุ
ตสาหกรรมเกษตรและอุ
ตสาหกรรม
ที่
เกี่
ยวข
องกั
บอาหารมี
มู
ลค
าโดยรวมที่
95.3 ล
านล
านเยน นั
บเป
นหนึ่
งใน
อุ
ตสาหกรรมที่
ใหญ
ที่
สุ
ดในญี่
ปุ
น คิ
ดเป
นร
อยละ 11 ของการผลิ
ตภายในประเทศ
“อั
ตราความพอเพี
ยงทางด
านอาหารในประเทศญี่
ปุ
นมี
แนวโน
มลดลงใน
ระยะยาว” Mr. Hajime Matsuo ผู
อำนวยการสำนั
กงานคณะกรรมการวิ
จั
ยภาค-
การเกษตร ป
าไม
และประมง จากกระทรวงเกษตร ป
าไม
และประมง กล
าว
พร
อมอธิ
บายเสริ
มว
าอั
ตราความพอเพี
ยงทางด
านอาหารในประเทศญี่
ปุ
นในป
2554 อยู
ที่
ร
อยละ 39 (อิ
งจากปริ
มาณแคลอรี
ที่
ผู
บริ
โภคได
รั
บ) และร
อยละ 66
(อิ
งจากปริ
มาณการผลิ
ต) ซึ่
งตั
วเลขทั้
งสองนี้
นั
บว
าต่
ำกว
าประเทศอื่
นๆ (ดั
งตารางที่
2)
ลั
กษณะการบริ
โภคอาหารที่
เปลี่
ยนแปลงไป ส
งผลให
อั
ตราความพอเพี
ยง
ทางด
านอาหารในประเทศญี่
ปุ
นได
ลดลงในระยะยาว ได
แก
• การบริ
โภคข
าวลดลง โดยลดลงถึ
งร
อยละ 50 จากป
2508
• การบริ
โภคผลิ
ตภั
ณฑ
ปศุ
สั
ตว
มากขึ้
น (เพิ่
มขึ้
นจากป
2508 ถึ
ง 3 เท
า) และ
การบริ
โภคน้
ำมั
นมากขึ้
น (เพิ่
มขึ้
นจากป
2508 กว
า 2 เท
า)
จำนวนแรงงานในภาคการเกษตร ป
าไม
และประมง ก็
ได
ลดลงอย
างต
อเนื่
อง
โดยอยู
ที่
ระดั
บ 2.4 ล
านคน จำนวนครั
วเรื
อนที่
ประกอบอาชี
พการเกษตรก็
ลดลงกว
า
ร
อยละ 60 จาก 6.06 ล
านครั
วเรื
อนในป
2503 มาเป
น 2.53 ล
านครั
วเรื
อนในป
2553 โดยมี
จำนวนประชากรที่
ประกอบอาชี
พเกษตรกรเพี
ยงอย
างเดี
ยว 2.05 ล
านคน
และเกษตรกรเหล
านี้
มี
อายุ
เฉลี่
ยที่
66.1 ป
ทั้
งนี้
ผู
ที่
ประกอบอาชี
พเกษตรกร
เพี
ยงอย
างเดี
ยว คื
อ ผู
ที่
มี
อายุ
15 ป
ขึ้
นไป และมี
อาชี
พหลั
กในการทำการเกษตร
ส
วนผู
ที่
ทำงานในภาคการเกษตร คื
อ ผู
ที่
มี
งานหลั
กเป
นพ
อบ
าน แม
บ
าน หรื
อเป
น
พี่
เลี้
ยงเด็
ก และทำการเกษตรในเวลาว
างอื่
นๆ
Note:
Figure for Japan is FY2011 estimate. Figures for other countries are from trial calculation in 2009.
Source:
Food Balance Sheet by MAFF
Note:
Japan imports almost all feed grains required for livestock production.
Therefore, the caloric intake-based self-sufficiency is low even though
production is high.
Table 1
International comparison of economic position of agriculture (Unit: Percent)
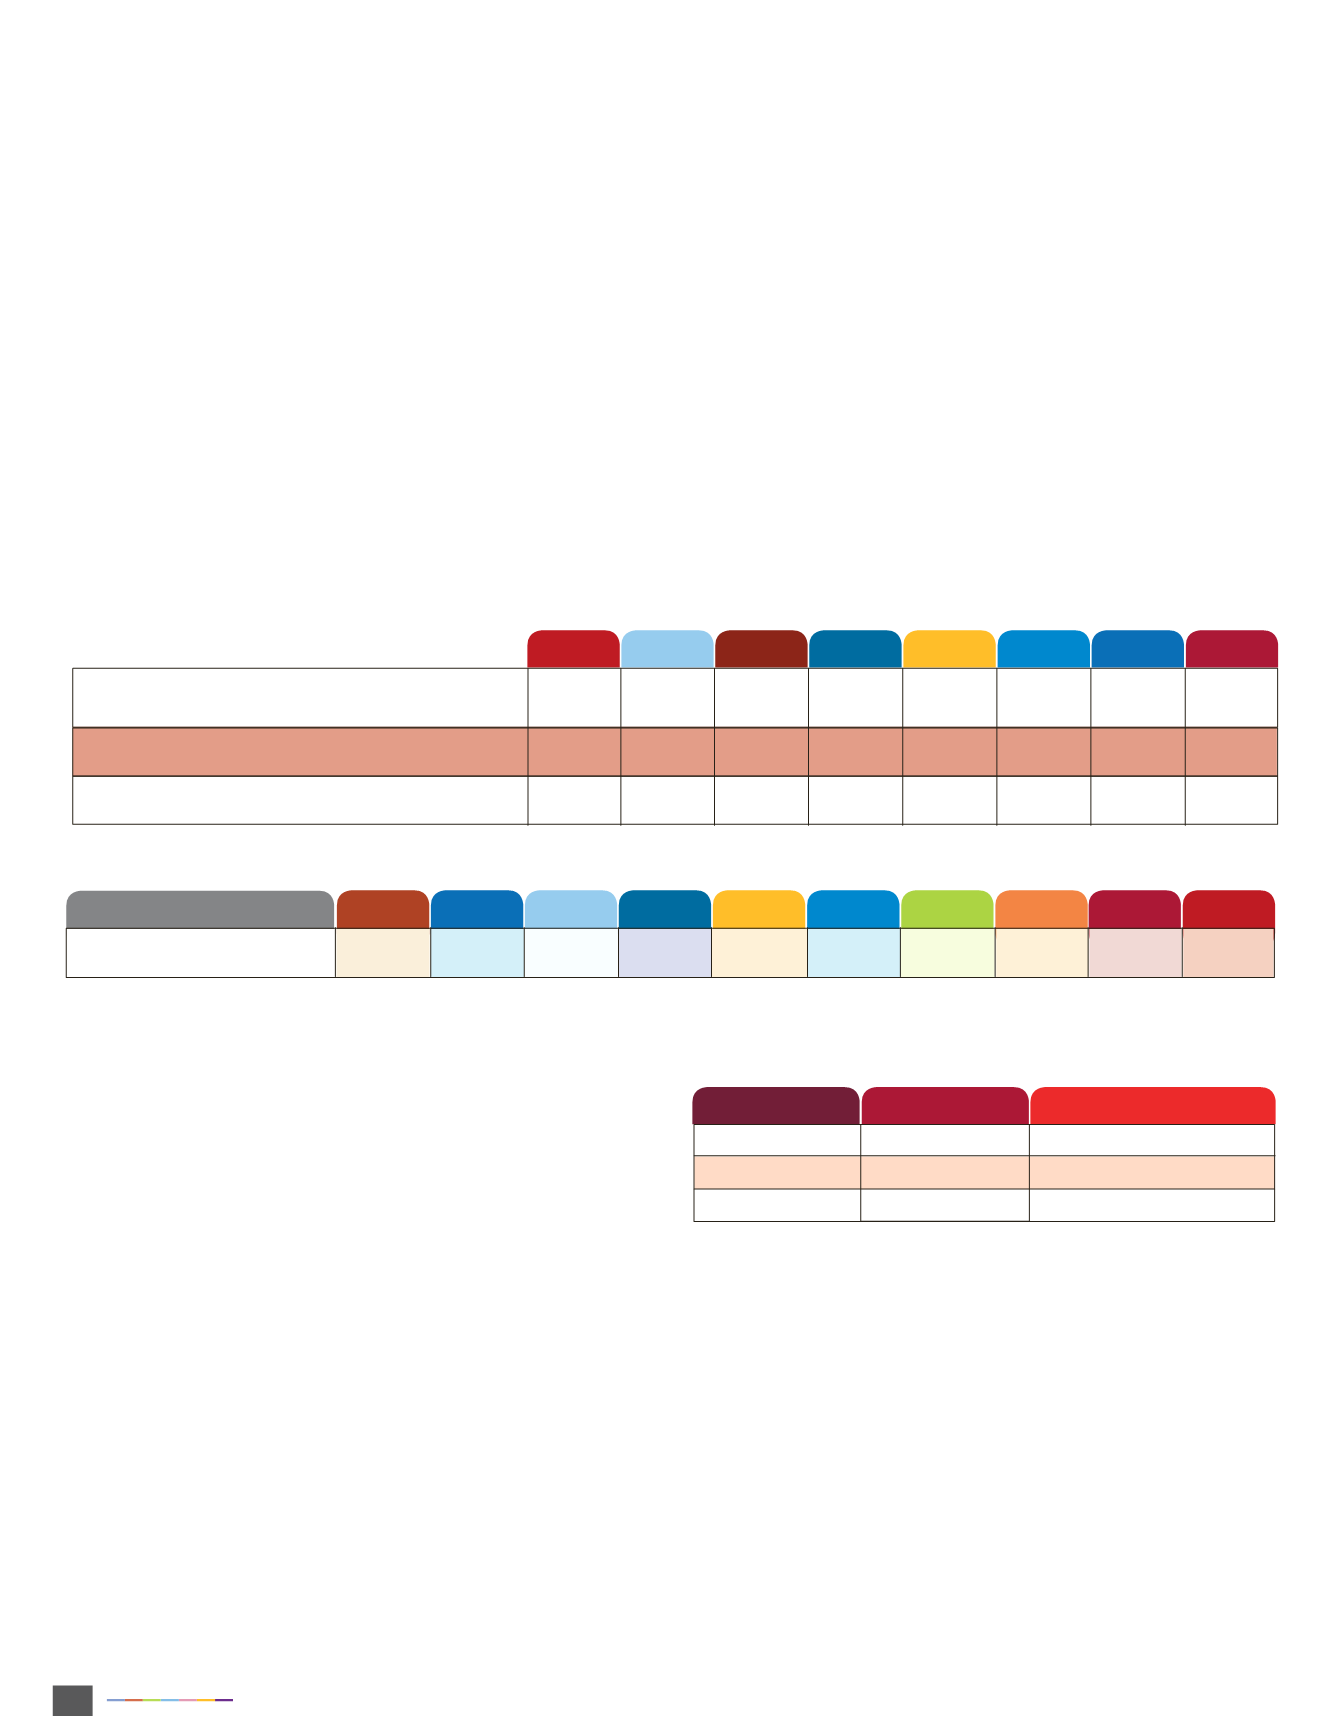
Table 2
Comparison of caloric intake-based food self-sufficiency rates (Unit: Percent)
Table 3
Changes in consumption (per person per year)
Percentage of nominal GDP accounted for by total
agricultural, forestry, and fisheries production
Percentage of agriculture budget accounted for
by the national budget
Average farming area
(in hectares)
Rice
Meat
Oil
111.7 kg
9.2 kg
6.3 kg
57.8 kg (50% lower)
29.6 kg (3.2 times higher)
13.5 kg (2.1 times higher)
1.2
2.0
2.3
1.1
3.6
169.6
1.6
42.1
14.1
1.8
4.8
52.6
0.8
3.8
55.8
0.6
1.1
78.6
2.3
0.8
2,970
2.3
5.9
1.5
“The food self-sufficiency rate is in a long-term decline.” said Mr.
Hajime Matsuo, Director of Agriculture, Forestry and Fisheries Research
Council Secretariat, Ministry of Agriculture, Forestry and Fisheries
(MAFF). He also explained that the food self-sufficiency rate in 2011 was
39 percent based on caloric intake and 66 percent based on production.
And these figures are lower than other countries (see Table 2).
The dietary changes have led to decline in the food self-sufficiency
rate. In Japan, the long-term decline of food self-sufficient rate is attributed
to changes in diet as followed;
• Decrease in rice consumption, whose self-sufficiency rate is 100
percent (approximately 50 percent decrease from FY1965)
• Increase in livestock products consumption (approximately 3 times
higher than the FY1965 level) and oil consumption (approximately 2 times
higher than the FY1965 level)
Canada
Country
Australia
US
France Germany England
Italy
Korea
Switzerland
Japan
Self-sufficiency
223
187
130
121
93
65
59
50
56
39


